
Gold pricing -The dollar gives value and the dollar takes it away
Unquestionably dollar strength or weakness plays an extremely critical role in day-to-day price changes of gold. Intrinsically dollar strength or weakness has an exact correlation to price changes in gold. That is because in North America gold prices are paired against the U.S. dollar. Market sentiment that defines whether traders and investors are bidding gold prices higher or lower is always only partially responsible for gold’s net price change.
Yesterday, market participants were aggressive buyers taking the price of spot gold roughly $24 higher. However, dollar strength played a critical role resulting in a net gain in gold of only $9.10.
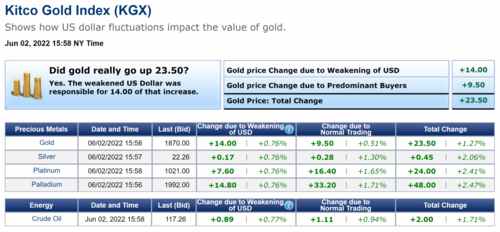
Today, we are seeing the exact opposite reflection with dollar weakness resulting in over half of the gains. As of 4 PM EDT spot gold is fixed at $1870 after factoring in a net gain of $23.50. According to the Kitco Gold Index (KGX), dollar weakness accounts for $14 of today’s move, and market participants bidding gold prices higher accounts for the remaining gain of $9.50.
Gold futures basis the most active August 2022 contract is currently fixed at $1873.50 after factoring in today’s gain of $24.90 or 1.35%. Concurrently the dollar index is fixed at 101.785 after factoring in today’s decline of 0.744 points or 0.73%. As in spot gold, today’s gains in gold futures reflect the same ratio with both market participants actively buying and dollar weakness contributing to the overall gains.
This brings us to our current technical analysis of the dollar. The dollar tends to have multi-year cycles of strength and weakness.
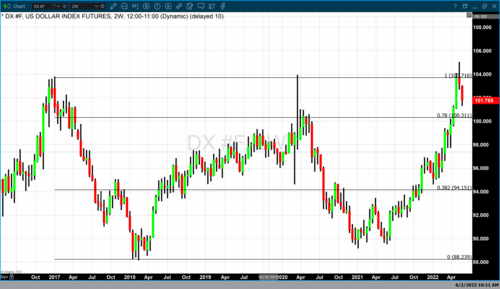
The chart above is a two-week candlestick chart of the dollar index. At the beginning of 2017, the dollar completed a dynamic rally beginning in 2014 when the dollar index was trading at approximately 79. Over three years, the dollar hit an apex just above 103 which was followed by a strong price decline from 2017 until January 2018. This correction took the dollar index from 103 down to 88.23. The relative value of the dollar declined by approximately 16%. Following the correction that concluded in 2018, there was a multiyear rally with the dollar gaining value up until the first quarter of 2020 when the dollar reached an apex of 103 once again. Just as in the top that occurred in 2017 what followed in 2020 was a price correction that lasted approximately a year and ½ resulting in a decline in dollar value of approximately 15%. In other words, historically speaking the dollar tends to have extended periods of strength and extended periods of weakness. The latest top that was achieved in the dollar index in w
hich for the third time since 2017 the dollar index hit a top or apex between 103 and 105. As of today, the dollar index has declined from 105 to 101.76.
This brings us to our observation today which is that the U.S. dollar historically will have extended rallies and extended declines which can last a year or more. While past performance does not guarantee that we will witness the same occurrence once again, it does suggest that we could see a decline in dollar value over this next year or longer. If the dollar continues to have defined longer-term trends, then we may see the dollar index decline in this instance. If that assumption proves to be correct it will have a profound impact on gold creating bullish market sentiment for the precious yellow metal.
By Gary Wagner
Contributing to kitco.com
Time to buy Gold and Silver on the dips
David