Gold corrects after unsuccessfully challenging its record high
On Tuesday, March 8, gold traded to an intraday high of $2078, roughly $10 below the all-time high of $2088, which was achieved in August 2020. The current decline in gold is the first real price decline since January when gold hit a low of approximately $1780. Until Tuesday of this week, what followed in February was a dynamic rally resulting in gold gaining approximately $300 when gold traded to $2078. On Wednesday, March 9, gold opened above Tuesday’s closing price of $2043 but closed dramatically lower, resulting in a price decline of $72. Tuesday’s strong decline resulted in gold losing 3.49% in value, the largest single-day loss in 2022.
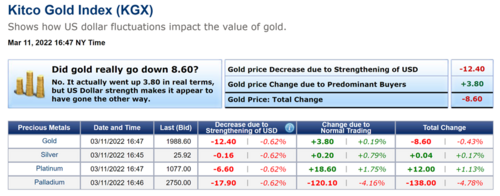
As of 4:45 PM EST gold futures basis, the most active April Comex contract is currently fixed at $1990.20, a net decline of $10.30 or 0.51%. However, this decline can be largely attributed to dollar strength. Currently, the dollar is up by 0.63% and with the dollar index fixed at 99.12. While gold pricing is lower today it is completely the result of dollar strength and fractional buying of gold.

Currently, spot gold is fixed at $1988.60, a net decline of $8.60 on the day. The Kitco Gold Index shows that dollar strength resulted in gold declining $12.40, and fractional buying resulted in a gain of $3.80 resulting in the net change today of -$8.60.
This week’s price action marked the beginning of the first correction since the end of January. Currently, gold has declined approximately 0.382% from Tuesday’s intraday high at $2078 to today’s low of $1960. 0.382% is an important Fibonacci retracement number. A shallow price correction based on Fibonacci retracement levels will begin at 0.236%, followed by a decline of 0.382% with a strong correction retracing as much as 0.618%, or 0.78%. On a technical basis, these four Fibonacci retracement levels are the most important numbers to focus on. Technical traders use these levels to monitor possible support levels that could indicate a conclusion of a correction.
That being said, based on a study of three different moving averages (50-day, 100-day, and 200-day), gold is still in full bullish alignment. Market technicians use the 50-day, 100-day, and 200-day moving averages as a benchmark to determine its short-term, interim term, and long-term market sentiment. If the current pricing of a stock or commodity is above the 50-day moving average market technicians interpret the short-term market sentiment as bullish. The 100-day moving average is used to determine interim term market sentiment, and the 200-day moving average reveals long-term market sentiment. If the 50-day is above the 100-day and the 100-day above the 200-day, it is interpreted as a full bullish demeanor.
Chart number two is a daily candlestick chart of gold futures, clearly illustrating that gold is in full bullish alignment. The 50-day moving average is currently fixed at $1861.70, followed by the 100-day moving average at $1832.20 and the 200-day moving average fixed at $1816.10. Gold pricing went into full bullish alignment during the last week of February when the 100-day moving average crossed above the 200-day moving average. As gold pricing continues to rise, we can see that the three moving averages are in a period of divergence, which simply means that the price between each moving average is increasing.
Based on the two technical studies we discussed above, we can derive the following conclusion. First, on a technical basis, the low in gold futures has touched upon the 0.382% Fibonacci retracement level, which is an acceptable level if this current correction will unfold as a shallow correction, as seen in chart 1. It does not confirm that pricing will stabilize here, but it is an important level to watch if gold prices hold this level ($1964) or trade below it. Secondly, even with this week’s correction resulting in a 5.48% decline in pricing from Tuesday’s high to today’s low, the three moving averages are still in full bullish alignment, as seen in chart 2.
Lastly, while we could see a further price decline on a technical basis, this week’s price decline has not resulted in major chart damage but has resulted in a price correction from Tuesday’s intraday high.
By Gary Wagner
Contributing to kitco.com
Time to buy Gold and Silver on the dips
David