Could we see gold enter a corrective upside bounce?
Although multiple factors will influence the price of a stock or commodity, there are three primary essentials that market participants continue to focus upon because they provide insightful information.
First and foremost are fundamental events. In the case of equities events such as earning reports, share prices versus forward earnings, and forward guidance are critical components of the necessary information the astute investor uses to guide his or her investments. For the financial market, participants use economic indicators to gain insight to gauge the overall state of the economy. Some of the most important indicators are GDP (gross domestic product), employment figures, consumer spending, inflation, and interest rates.
The second essential method to the use of technical indicators such as moving averages, candlesticks, retracements, Bollinger bands…

The third method used by an investor is market sentiment. Investopedia says “Market sentiment refers to the overall attitude of investors toward a particular security or financial market. It is the feeling or tone of a market, or its crowd psychology, as revealed through the activity and price movement of the securities traded in that market. In broad terms, rising prices indicate bullish market sentiment, while falling prices indicate bearish market sentiment.”
It was the “crowd psychology” that market technician R.N Elliott attempted to mathematically quantify when he created “the wave principle” in 1938. His theory relies on the assumption that price changes occur in a cycle that is repeated and can be identified through pattern recognition. This technique is used whether a market is in a bullish or bearish trend. Simply put, the theory expounds that the trend of a stock or commodity will unfold as a total of eight waves. The first five waves will move in the prevailing trend is called the impulse phase. This will be followed by a corrective phase (typically three waves) that will move in the opposite direction of the current trend.
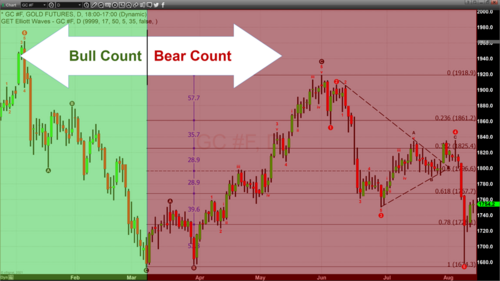
In the case of gold, our current technical studies indicate that a bullish cycle concluded at the beginning of March 2020 after completing an A, B, C correction. The first part of the bearish cycle or bearish Elliott wave count began as a corrective upside move (A, B, C) taking gold from $1670 to $1920 in June 2020. What would follow is an impulse phase which is composed of five waves with waves 1,3,5 moving in the primary trend, and to counter waves in the opposite direction of the primary trend, waves 2 and 4.
Our studies indicate that the major drop that occurred following the release of last month’s jobs report completed the fifth and final wave of the impulse phase. If correct, that would mean we are about to enter a corrective period in gold which could take pricing higher.
There are two major caveats to the Elliott wave principle, first, it is not accepted by many prominent market analysts. Many analysts use and implement this theory as a key component used to forecast markets, and many analysts remain skeptical and favor a more traditional technical approach to market forecasting.

Secondly, it is a technical study that is both an art and science in that there is room for interpretation. This technical study is not as black-and-white as a moving average or a stochastic indicator which have defined parameters that will allow all market technicians to obtain the same conclusions.
That being said, after working with this technique for over 25 years and combining it with Fibonacci ratios and Japanese candlestick pattern recognition I found it to be an extremely insightful tool in my technical toolbox.
For those who would like more information, simply use this link.
Wishing you as always, good trading,
Contributing to kitco.com
Kinesis Money the cheapest place to buy/sell Gold and Silver with Free secure storage
David