Gold scores fractional gains even though the dollar recovered from the lows of the day
As of 5:15 PM EST, the most active June 2021 contract is currently fixed at $1838.40, which is a fractional gain of $0.80 on the day. However, the real news in trading today was the intraday low that came in at $1817.80 before recovering over $20 to close with modest gains on the day. Gold made a trade to a lower high than yesterday, but market participants focused immensely on the selloff that occurred during the trading session.
Much of today’s selloff was directly related to the U.S. 10-year Treasury note, which now is yielding 1.62%. Gold also recovered as the U.S. dollar traded to a low of 89.95 and recovered unchanged at 90.185. Even though the dollar closed unchanged, it did make a lower low than the previous day. In fact, the last time the dollar traded below 90.00 was on February 25 of this year. In January, the dollar index traded to its lowest value this year, hitting an intraday low of 89.15.
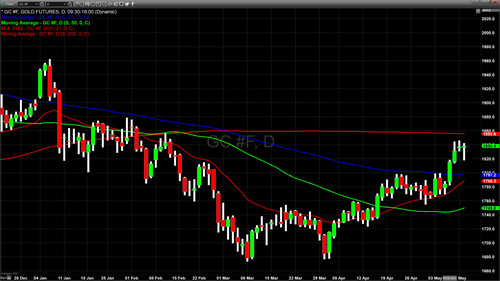
The fact that we are now witnessing gold solidly above $1800 expresses a strong change in market sentiment from neutral to bullish. Considering that before we saw gold rise above $1800, it was mired in an extremely narrow trading range that was defined by support at the 21-day exponential moving average and resistance occurring at the 100 – day moving average. During the beginning of May, we had multiple occurrences in which market participants were able to move gold pricing just below the 100-day moving average, which then was at approximately $1800 and is now fixed at $1797.20.

The break above $1800, which occurred on May 6, took gold from an opening price of $1787 and then closed solidly above $1800, closing at $1816 on May 6. This was followed by another dramatic rise in gold pricing, with gold opening just above the closing price of May 6 and closing at $1832 on Thursday of last week. Yesterdays and today’s trading activity created two consecutive Japanese candlesticks called a “Doji.”
This type of candlestick can be found at market tops and bottoms as the pivotal candle indicating a key reversal. However, they are also prevalent after a market has made a sustained move to higher or lower ground and consolidates at that new price point.
In the case of the last two trading days, my interpretation is that we are witnessing a period of consolidation. This is based on our technical studies, which indicate that major resistance does occur until approximately $1855. This is the most logical point on a technical basis where we could see resistance occur. Up until that price point, there are no major levels that we can identify as strong resistance. Therefore, I believe we will see gold continue to move higher, at least until $1855.
By Gary Wagner
Contributing to kitco.com
Kinesis Money the cheapest place to buy/sell Gold and Silver with Free secure storage
David