Gold encounters resistance at $1918 but remains above $1900
Gold prices oscillated between today’s low of $1889.70 and high of $1918.30. As of 4:15 PM, gold futures basis's the most active April contract is currently fixed at $1901.30 after factoring in today’s gain of $1.50 or 0.07%. This article will focus upon today’s high as it occurs at a key level of possible strong resistance. Historical data has shown this price point is important in both short and long-term studies as evidence that $1920 is a key technical level that remains in play.

Chart number one looks at gold from August 2020 reaching its record high to the correction that followed. After trading to the record high of $2088, gold began to a steep price decline taking gold from the record high to a low of approximately $1675 in March 2021. What followed was a clear and defined range with highs defined at $1920 and a low of $1670. There have been two instances since gold declined from $2088 when gold traded to a high of $1920. The first occurrence was in June 2021 with today’s high marking the second occurrence.

Chart number two is a long-term weekly chart highlighting the first occurrence of gold reaching a value above $1900. This occurred In the middle of 2011 as a direct result of quantitative easing by the Federal Reserve to revitalize the economy after the recession of 2009. Because it was a new record high and the long at attracted correction that followed this price remains a strong technical area that is currently acting as resistance but could become support once that price is taken out. This is why we believe that today’s high price could be a technical level where gold encounters significant resistance.

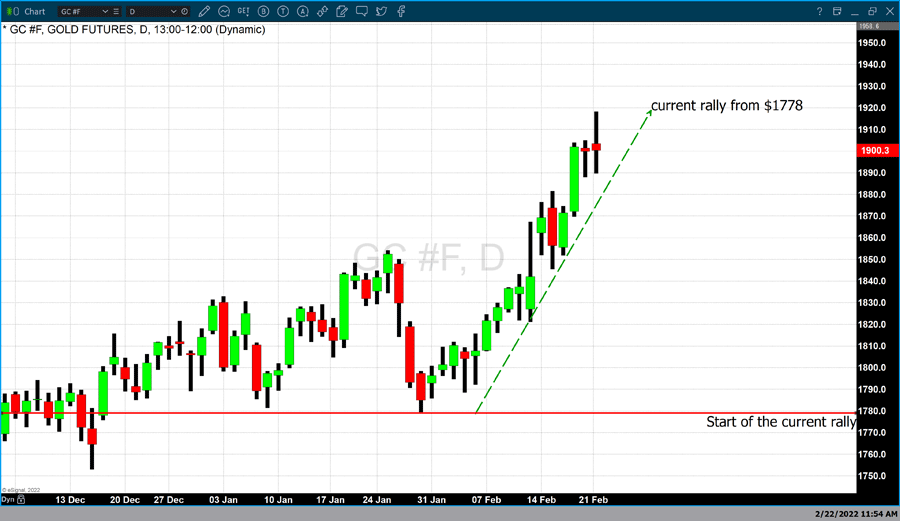
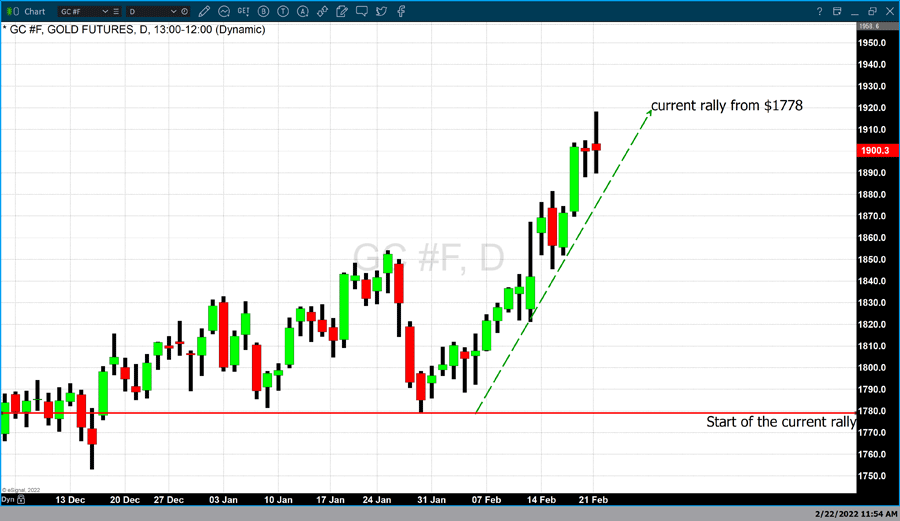
Chart number three is a daily candlestick chart of gold futures highlighting the current rally which began in the last days of January when gold traded to a low of $1778 and gained almost $140 in under one month.
The price advance in gold was initially brought about by spiraling levels of inflation reaching a 40-year high. The most recent CPI index report indicated that inflation in January rose to 7.5% the highest level of inflation since 1982. More recently we have seen geopolitical tensions between Russia and Ukraine combined with inflationary concerns take gold to the highs achieved today.
It will be the outcome of the current geopolitical tensions between Ukraine and Russia as well as inflationary concerns that will continue to be highly supportive of gold prices. However, as seen in recent rises in U.S. debt instruments market participants are currently factoring in an extremely aggressive Federal Reserve as they begin a series of rate hikes in attempts to stave off and reduce the current level of inflation. This will create bearish undertones for gold as it reacts to higher levels of interest rates.
By Gary Wagner
Contributing to kitco.com
Time to buy Gold and Silver on the dips
David