Some price pullback is healthy for gold
Consider this, gold has had a price range from Friday’s low ($1457) to Tuesday’s high (1698.60) of $241. If you compare Friday’s opening price ($1470) to Tuesday’s close ($1660) Gold had gained a total of $190 over three trading days. Based on the rapid ascent of gold pricing today’s moderate selloff I believe is healthy.
We have all witnessed markets that have entered what is known as a parabolic rise, or more commonly referred to as a J curve, and on the majority of instances the steeper the climb the harder the fall. Gold has experienced a dramatic price increase from Friday’s open up until Tuesday’s close. Which means that today’s decline of approximately $21 in gold futures is a healthy pullback.

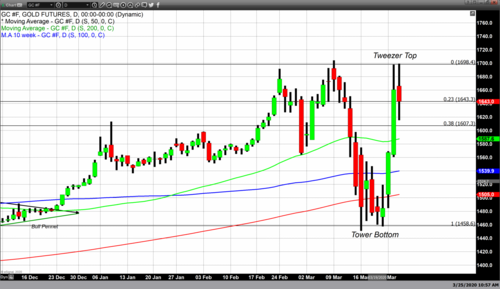
As of 4:45 PM EST gold futures basis the most active April contract is currently fixed at $1640.50. That is just $20 off of yesterday’s close. If we create a Fibonacci retracement from the low of Friday to the high of Tuesday or today, the current decline is approximately at the 23% Fibonacci retracement level. While that is considered a mild pull back, current pricing at $1641.30 is well off of today’s intraday low of $1615.70

Our technical studies currently indicate that major support occurs between $1600 and $1607 which is the 38% Fibonacci retracement. The studies also indicate the first level of minor support at $1643.30, the 23% retracement level.
Another noteworthy aspect of the last two trading days has been that on both occasions traders have moved gold futures as high as $1699.02 days in a row. This creates a candlestick pattern simply known as a tweezer top. This pattern requires two consecutive days to have approximately equal highs. It differs from a tower top or bottom in that that pattern requires multiple candles to find support or resistance at approximately the same price point. We can see an example of that on today’s daily chart which shows a tower bottom occurs at approximately $1458.60.
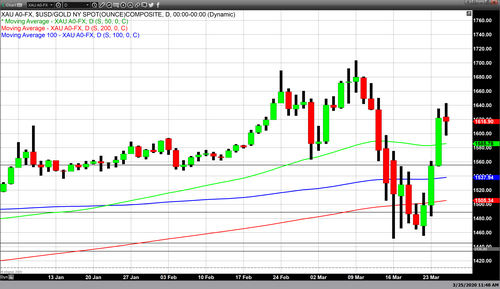
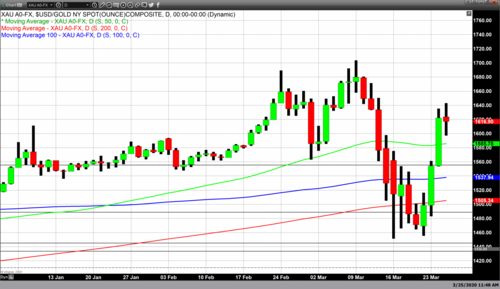
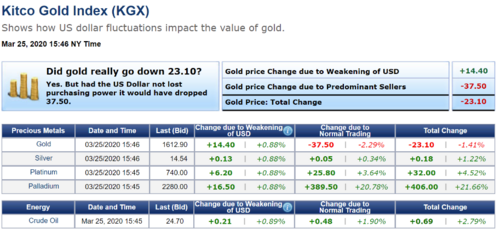
The other interesting observation about gold pricing over the last few weeks has been the large difference between spot prices and futures pricing. Currently spot gold is trading at $1616.40 which is a net decline approximately five dollars on the day. Compared to current futures pricing at $1643 the differential between April futures and spot gold is roughly $27. In my experience as a former commodity broker, former CTA and now a market analyst I have never seen the differential between spot and futures most current month being this large.

What is more perplexing is that spot is currently below futures pricing and according to a report in MarketWatch, Josh Strauss, partner at money manager Perkin Hardy Strauss in Chicago says that “there is no gold. There’s roughly a 10% premium to purchase physical gold for delivery. Usually it’s like 2%. I can buy a one-ounce American Eagle for $1,800. Kitco reported today that it was out of almost all standard 1-ounce gold coins. American eagles and buffaloes, issued by the US Mint are both out of stock.
Which beckons that we ask the following question; if there is such a shortage now why is spot pricing in gold below the most active April contract of gold futures. One plausible explanation would be that the expecta
Wishing you as always good trading,
By Gary Wagner
Contributing to kitco.com
David